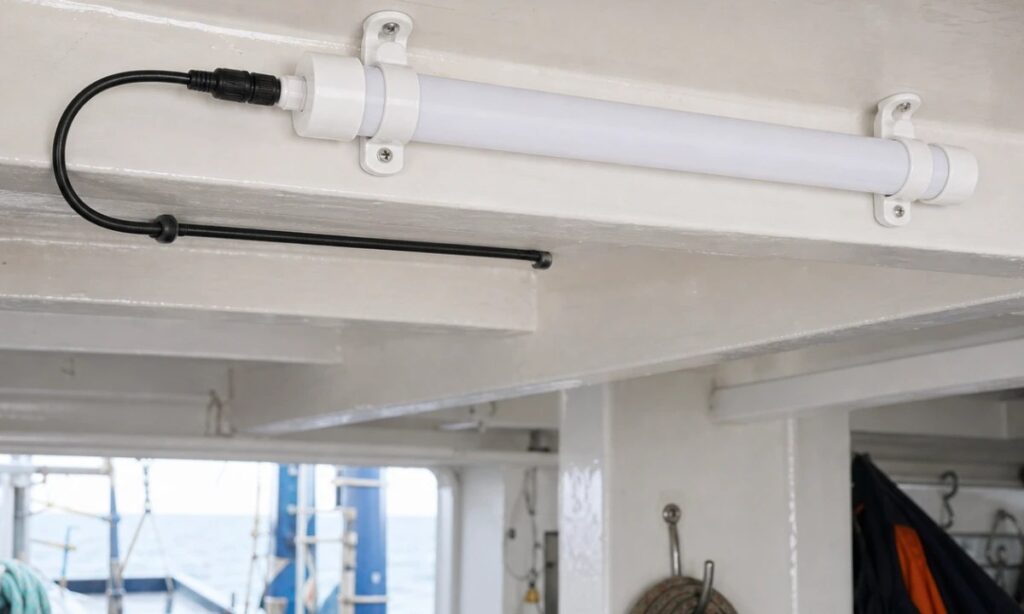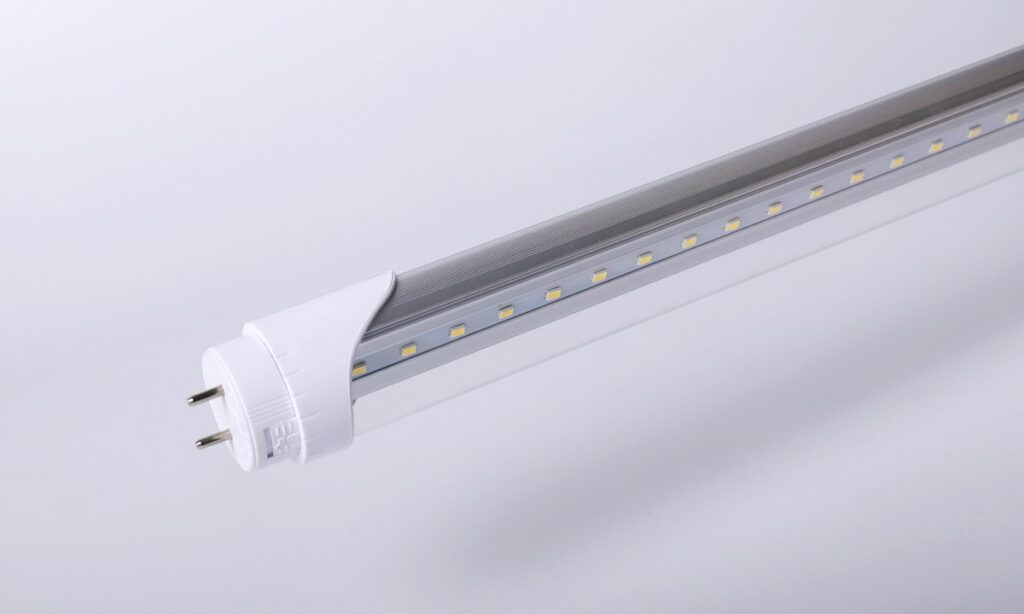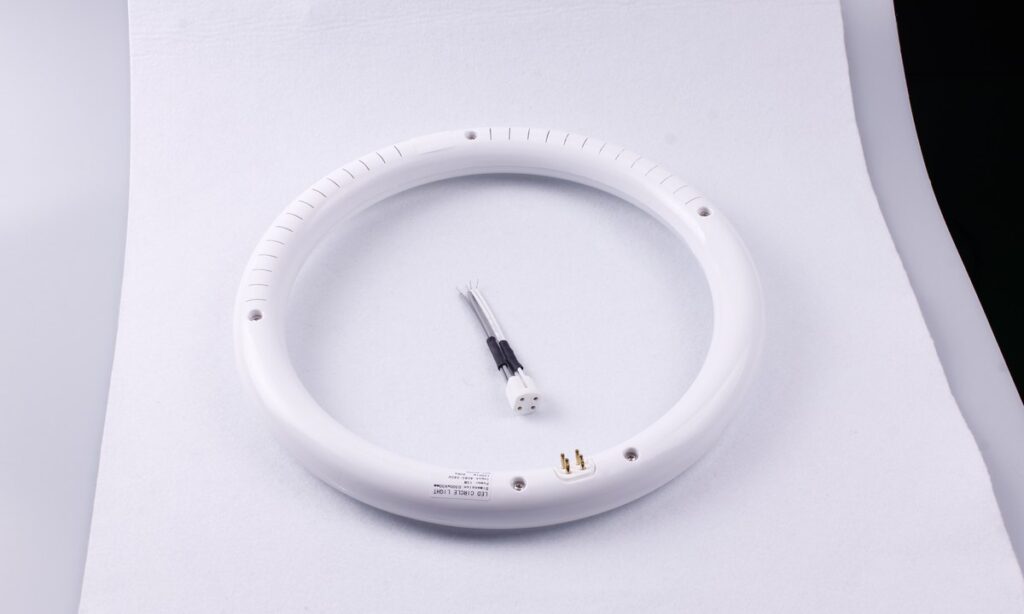


Smart T8 scheduling and automation reduce energy use only when they shorten operating time or lower system power relative to a defensible baseline. The word “smart” does not create the saving. A schedule must remove hours that would otherwise have been lit; a sensor must reduce output during real vacancy or available daylight; and the result must exceed the energy used by controls, radios and gateways.
That gives facility and energy teams a practical sequence: define the baseline, select control layers for actual waste patterns, confirm that the T8 electrical architecture supports them, commission every zone, and measure the integrated result.
Treat automation as an operating strategy for a complete lighting system, not as a label attached to a lamp. Two projects using the same tube can produce different outcomes because their hours, sensor coverage, daylight, dimming curve, override behavior and maintenance discipline differ. A useful estimate therefore states every input, keeps required safety operation inside the boundary and shows which values will be replaced by measurements during the pilot.
Where Each Control Layer Creates Value
The useful control depends on why energy is being wasted. Do not choose a feature before identifying the operating condition it should change.
| Control layer | Energy mechanism | Strong application signal | Commissioning check |
|---|---|---|---|
| Schedule | Removes predictable out-of-hours operation | Stable opening, shift, cleaning or stocking hours | Exceptions, holidays, override expiry and clock changes |
| Occupancy or vacancy | Reduces output when a zone is unused | Intermittent use, variable warehouse aisles or support rooms | Coverage, timeout, low-motion detection and failure mode |
| Daylight response | Dims electric light when daylight meets part of the task | Perimeter, skylit or daylight-accessible zones | Sensor view, setpoint, blinds, minimum output and stability |
| High-end trim | Caps output above the maintained task requirement | Existing light levels exceed the approved target | Illuminance, uniformity, glare and measured power curve |
| Demand response | Temporarily reduces selected noncritical load | Demand-charge or grid-event participation | Trigger, duration, recovery, override and protected zones |
Schedules and sensors often work together. A schedule can define when a building is normally active; occupancy control can then respond to variable use inside that window. The design should preserve required task, route, emergency and security lighting rather than treating every unoccupied signal as permission to switch everything off.
Start With System Energy, Not Lamp Wattage
A simple constant-power baseline is:
Baseline kWh = quantity × baseline system watts × annual operating hours ÷ 1,000
“System watts” must match the electrical boundary. A ballast-compatible lamp includes ballast losses. A direct-wire lamp uses a different power path. Connected lamps, sensors and gateways may also draw power when light output is off.
The baseline operating schedule should reflect reality, not just posted business hours. Include cleaning, restocking, overtime, weekend access, seasonal operations and existing manual overrides. If the project replaces lamps and adds controls at the same time, separate equipment savings from control savings where the available measurements allow it.
Record fixture quantity, measured system input power, zone schedule, existing controls, maintained light requirement, occupancy pattern, daylight access and the planned measurement period. The commercial LED tube retrofit guide helps define the fixture and application information that should accompany this energy baseline.
Use Product Capability as an Input, Not an Assumption
The control strategy must match the exact lamp and system. A connected tube may offer wireless light adjustment yet rely on another controller or platform for schedules, sensors, event logs or portfolio management. Confirm each required function rather than treating “smart T8” as one specification.
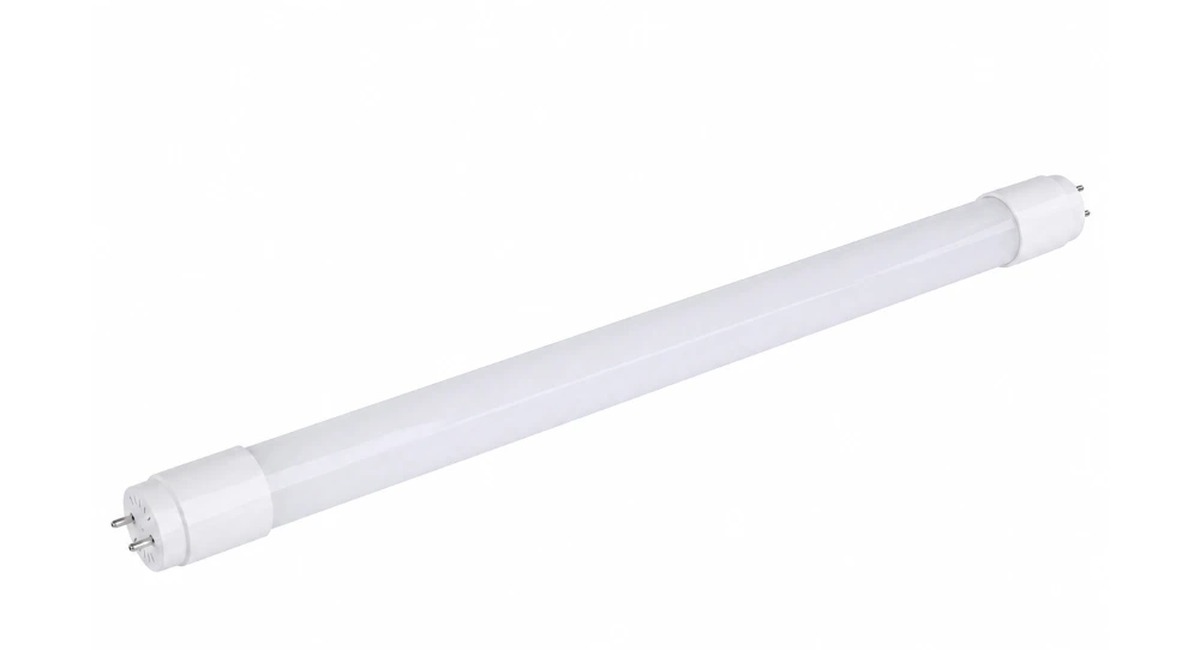
For occupancy-led applications, compare the requirements with the microwave motion sensor T8 tube. Where an external or defined dimming path is central to the plan, review the dimmable T8 tube family. These pages represent different product architectures; they should not be combined into one assumed feature set.
Before installation, identify Type A, Type B, Type C or another permitted configuration, the lampholders and wiring, the dimming interface, emergency functions and the target market. The LED tube installation guide explains why the retrofit type must be known before work begins.
Translate Runtime Changes Into a Load Profile
A 24-hour load profile makes the control logic visible. The baseline may hold every zone at full output for a broad operating window. The controlled profile can apply high-end trim, remove closed hours, reduce vacant zones and dim daylight areas.
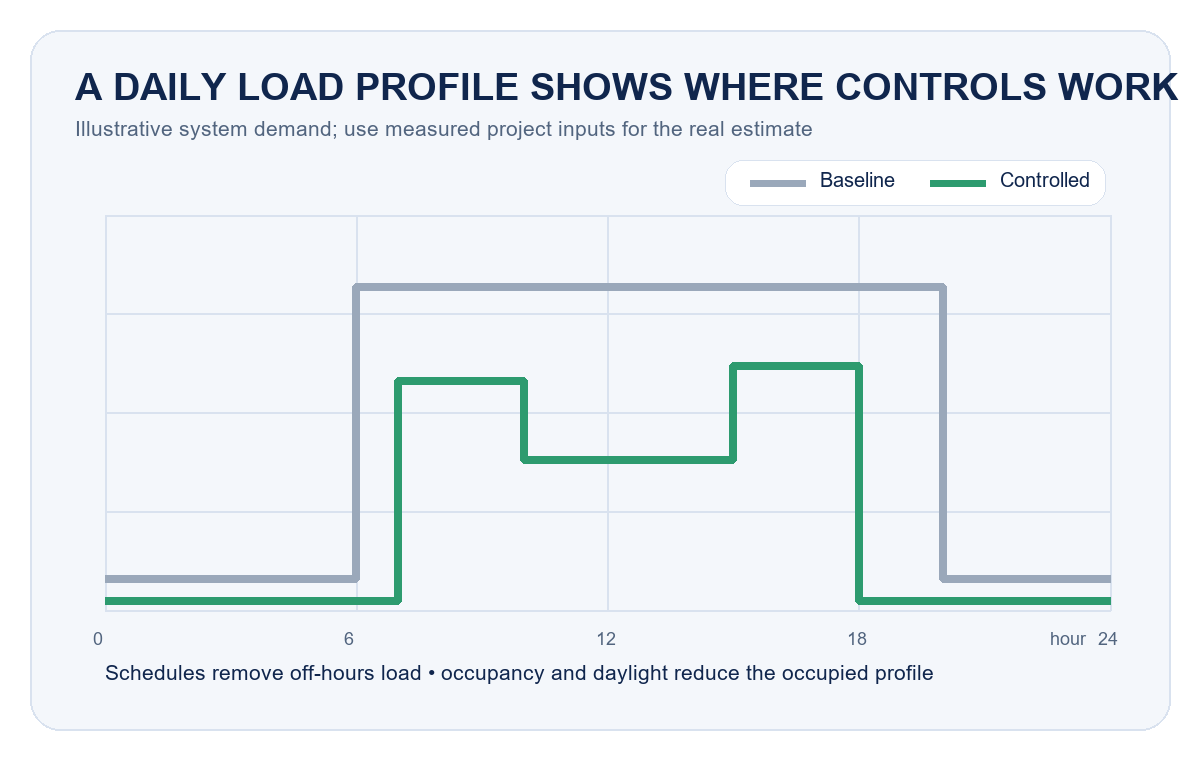
Do not add the nominal percentages from each control layer. The layers overlap. Once a schedule switches a zone off, occupancy control cannot save that same watt-hour again. Once daylight has reduced output, vacancy savings during that period apply to the lower load.
A sequential model is easier to audit:
- establish verified full-load system power;
- apply approved high-end trim;
- remove scheduled closed hours;
- apply occupancy or vacancy response inside active hours;
- apply daylight reduction to the remaining eligible load;
- add standby and dedicated control-system energy;
- compare the integrated result with the baseline.
Build a Worked Estimate From Project Inputs
Consider a hypothetical zone with 100 systems measured at 15 W and a 4,000-hour annual baseline. Validated scheduling and occupancy assumptions reduce equivalent full-load hours to 2,800, while controls and standby use 150 kWh per year.
| Calculation step | Formula | Result |
|---|---|---|
| Baseline lighting energy | 100 × 15 W × 4,000 h ÷ 1,000 | 6,000 kWh/year |
| Controlled lighting before standby | 100 × 15 W × 2,800 h ÷ 1,000 | 4,200 kWh/year |
| Controlled system total | 4,200 + 150 | 4,350 kWh/year |
| Estimated reduction | 6,000 − 4,350 | 1,650 kWh/year |
| Reduction relative to baseline | 1,650 ÷ 6,000 | 27.5% |
These inputs describe the example, not a product rating or project forecast. Replace quantity, system watts, operating hours, control effects and standby energy with measured or documented values from the target installation. Apply the local tariff separately and keep annual kWh savings distinct from peak-demand savings.
Design the Control Architecture and Failure Behavior
Control logic may run in the tube, a room controller, gateway, building-management system or cloud service. The connected-lighting specification guide covers the wider architecture, protocol, BAS and handover decisions that sit around the energy model.
For this calculation, document where schedules are stored, how clocks are synchronized, what happens during internet or gateway loss, how settings are backed up, and which user roles can alter them. Define the state after a power interruption and the process for replacing or re-addressing a lamp.
Networked controls also affect electrical quality and metering boundaries. If the project depends on dimming or software-reported energy, compare those readings with independent measurements and review the flicker, power factor and THD checklist for the exact operating modes.
Commission Before Claiming Savings
DOE notes that configuration complexity can prevent advanced lighting controls from delivering their intended performance. Commissioning therefore belongs inside the energy plan, not after it.
Test device addressing, schedule exceptions, sensor coverage, timeout, daylight setpoint, high- and low-end trim, manual override, emergency behavior, power recovery, network loss and logging. Confirm that the resulting light still meets the task and that occupants understand the available controls.
Record the final settings and responsible owner. A system can be technically connected while operating with factory defaults, permanent overrides or sensors aimed at the wrong zone.
Measure the Integrated Result
Plan measurement before installation so the baseline and post-control periods use compatible boundaries. Depending on the project, evidence may come from circuit meters, temporary loggers, fixture-level data or a combination.
DOE’s advanced-lighting-control M&V guidance explains that control projects require additional monitoring and calculation compared with a simple lamp change. Where practical, capture representative periods with individual layers enabled or disabled, then compare the fully integrated operation. Normalize material changes in occupancy, operating hours, weather, space use or production.
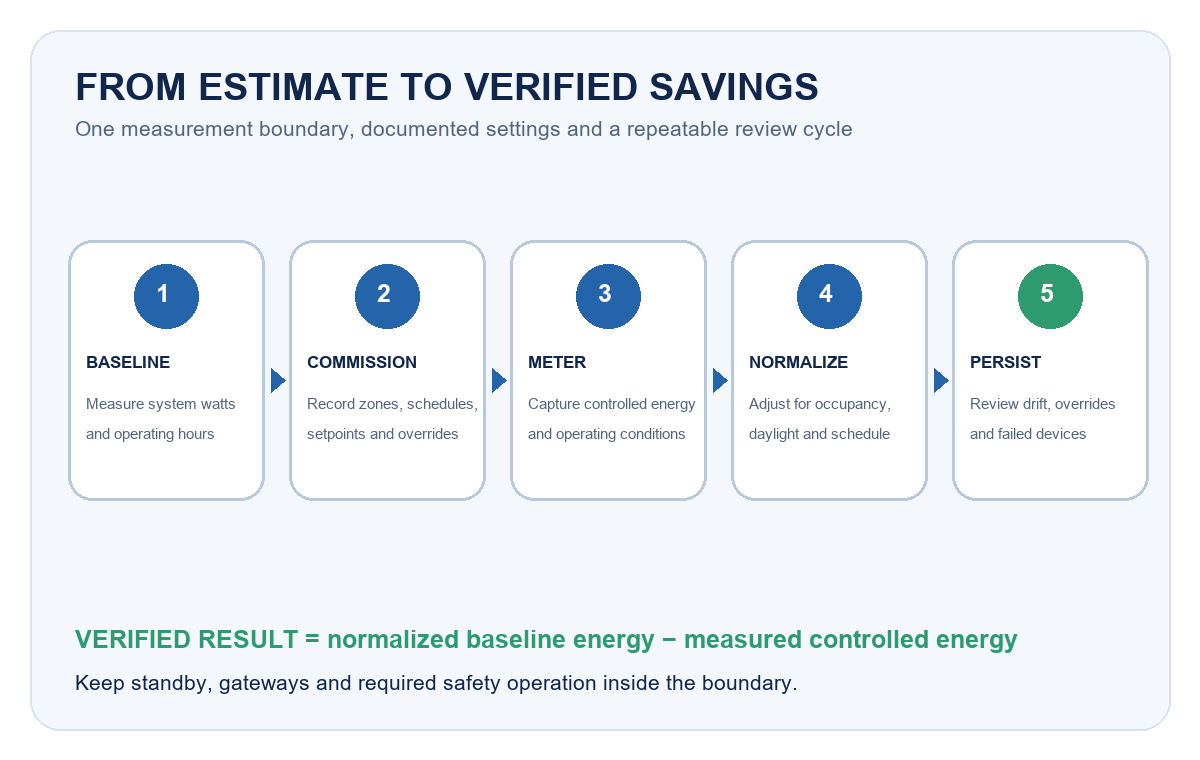
Software estimates are useful only after their boundaries and accuracy are understood. Reconcile them with independent measurements before using them for an investment decision. Recheck performance after handover because schedule drift, blocked sensors, permanent overrides and software changes can reduce savings.
Read Case Studies Within Their Boundaries
GSA reported a 43% reduction in LED lighting energy from advanced controls at one evaluated test-bed site. The same assessment also found that the added energy savings did not cover the added control expense at that site. Both findings belong together.
Use field studies to identify mechanisms and implementation risks. Build the project forecast from the target site’s operating pattern, installed power, control design, utility tariff, labor and maintenance conditions. A percentage without those boundaries is not a transferable specification.
Frequently Asked Questions
Do smart T8 tubes always save more than ordinary LED tubes?
No. They save more only when enabled controls reduce operating time or power by more than the standby and control-system energy added to the project.
What percentage can scheduling save?
There is no universal percentage. Calculate the hours that a validated schedule removes from actual baseline operation, then multiply those hours by the affected system power.
Are occupancy sensors better than schedules?
They solve different waste patterns. Schedules suit predictable hours; occupancy controls respond to variable use. Many projects combine them with defined priorities and override logic.
Does 50% light output mean 50% electrical power?
Not necessarily. Use the measured or documented power curve for the exact lamp, driver and control mode.
Should standby and gateway energy be included?
Yes. Include connected lamps, sensors, gateways and other dedicated control equipment inside the stated project boundary.
Turn the Estimate Into an Acceptance Plan
A defensible smart T8 project ties every estimated watt-hour to an operating change, every control feature to an exact product and system, and every setting to a commissioning record. The final result should be measured under representative conditions and reviewed again after handover.
For a bounded energy and product review, contact New Lights with fixture count, wiring architecture, measured system watts, schedules, occupancy, daylight, controls, target market and expected quantity.
Editorial Sources
- US Department of Energy, Lighting Controls Solutions: https://www.energy.gov/cmei/ssl/lighting-controls-solutions
- US Department of Energy, Measurement and Verification of Energy Savings and Performance From Advanced Lighting Controls: https://www.energy.gov/sites/prod/files/2016/03/f30/mv_lighting_control_wireless.pdf
- US General Services Administration, Advanced Lighting Controls and LED: https://www.gsa.gov/governmentwide-initiatives/federal-highperformance-buildings/highperformance-building-clearinghouse/completed-assessments/lighting/advanced-lighting-controls